
Below we will see how we can get data from a website (Web scraping) and then analyze it and draw statistical conclusions using the programming language Python
I will not go into the process of explaining the code, the scripts are ready and available for free at GitHub and anyone can use them or customize them as they like!

What is Web scraping?
By the term Web scraping we mean the extreatment data from a website using a program software. There are many programs of this type, such as ScrapeStorm which does a great job, but it's not free .. With the free version you can only use it once a day and it can only export 100 lines of one table at a time. Otherwise you have to pay about 50 € per month to have full operation! Of course not!
Obviously this did not cover me either so I wrote my own script in Python that exports everything from its page wordometers.
You can see the code here.
How does the scrap script work?
The script is simple, as you will see it is only 15 lines of code along with the spaces. Uses a package, the covid 2.2.6th, created by Johns Hopkins University and helps us gather the information we want from the above website. What I did was compile all this data into a .csv file so that we could later process it in some programming language. In short, I create a database on a daily basis, with just the push of a button and above all for free! I save this database on GitHub and can use it from anywhere.
Here you can see it .csv file with all the data by country, continent etc.
Script for data analysis with Python.
The script takes as input the data from the above .csv file and makes any analysis I specify. I have assigned him to calculate the following.
- Mortality calculation for each country
- Mortality calculation for each country
- Calculation of infection percentage of the population for each country
- Percent increase in cases compared to yesterday
- Percent increase in deaths compared to yesterday
- Percent of serious cases
- Percentage of those who recovered
- Percent active cases
- Cases per ten thousand of the population of each country
- Cases per one million population of each country
- Prints a Pie chart with the important data for each country
- How many tests were done and the percentage of tests that came out positive
Here you can see the script code GitHub
Example of the script output for Greece.
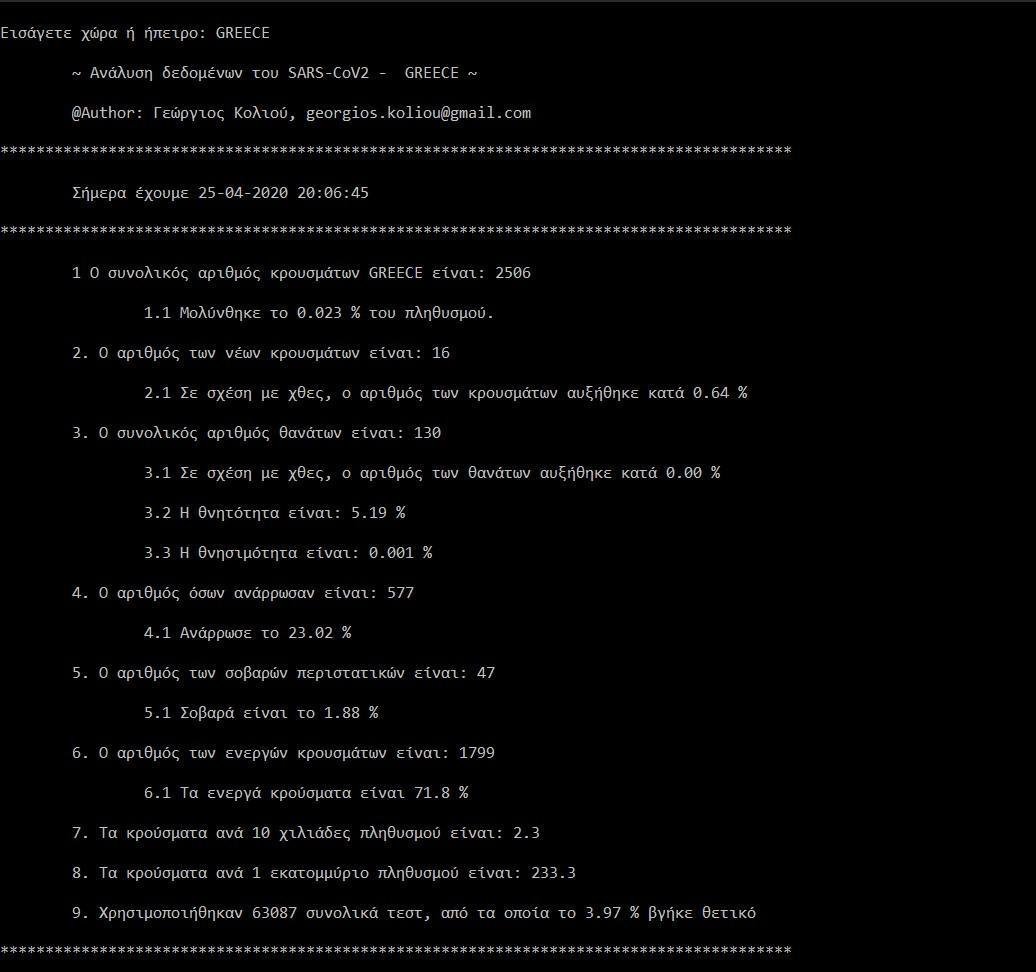
Basically what we do with Python and all programming languages is, once we write the code of what we want a program to do, it will do the same calculations every second, depending on the data we enter each time!

For Windows users
You can download from here the .exe script for Windows computers. Just double-click on the .exe you download and it will take the data of whichever of the following countries or continents you choose:
- WORLD
- ITALY
- SPAIN
- GERMANY
- NETHERLANDS
- BELGIUM
- GREECE
- FRANCE
- NORWAY
- PORTUGAL
- SWEDEN
- DENMARK
- LUXEMBOURG
- FINLAND
- AUSTRIA
- CZECH REPUBLIC
- IRELAND
- ICELAND
- CYPRUS
- SWITZERLAND
- UK
- NORTH AMERICA
- EUROPE
- ASIA
- SOUTH AMERICA
- OCEANIA
- AFRICA
- USA
The input of the country / continent must always be in Latin characters and in capitals as shown above. To see the diagram you need to install the following library pymetasploit3 simply by opening the Windows terminal and writing the following.
pip install pymetasploit3
Press enter and wait for it to finish.
For Linux users
Linux users can run the script directly from the terminal by downloading this archive and after they have primarily installed Python on their computer.
sudo apt install python3
sudo apt install pythonpy
pip install pymetasploit3
After all of the above are installed (and whatever else the terminal warns you is missing), open the terminal on the tab where you saved the script, run the following
py worldmeters_analysis.py
Press enter and if there is no error it will run and ask you to enter a country or continent exactly as described for Windows users.