
Have you ever tried to correct the loading time of your web pages and applications? Does your web store or other web application respond more slowly as you continue to add more features or as data grows?
The time it takes for your web applications to respond when users visit them is much more important than ever!

Personally, I can confirm this after seeing tangibly benefits from reducing server response, network connection and loading times of each page of this site. Without going into specifics, some of the benefits include: longer time spent on site by users, increased engagement and more conversions.
Essentially we are talking about the performance that the end users of your web applications receive. But where should you start? This will vary from case to case. A good start is to start testing. There are tons of online tools that allow you to scan your page and see where it stands. You can see web.dev services, GTmetrix, pingdom, webpagetest etc.
The results may look something like this:
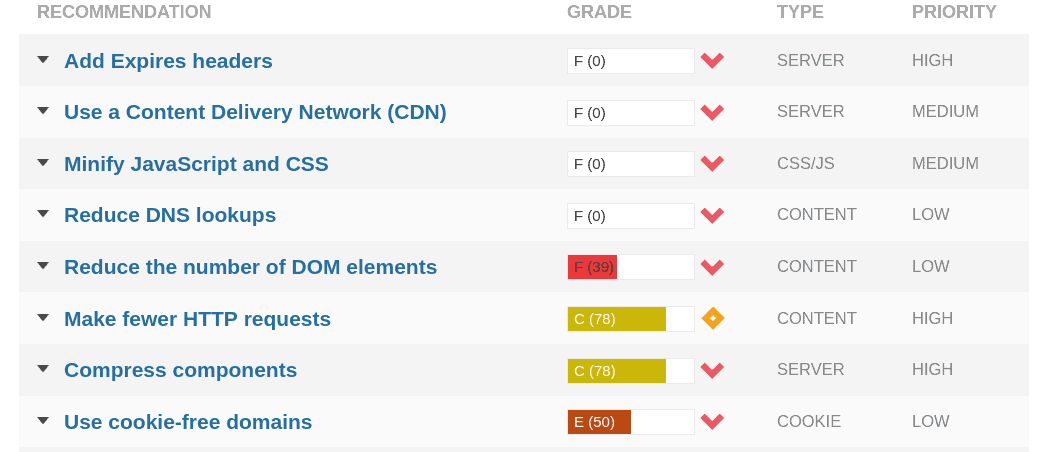
In this case, you have many more things to deal with before seriously considering TTFB. However, if the UI test result is closer to the screenshot below, most of the time you can continue to improve page load times by reducing the TTFB.
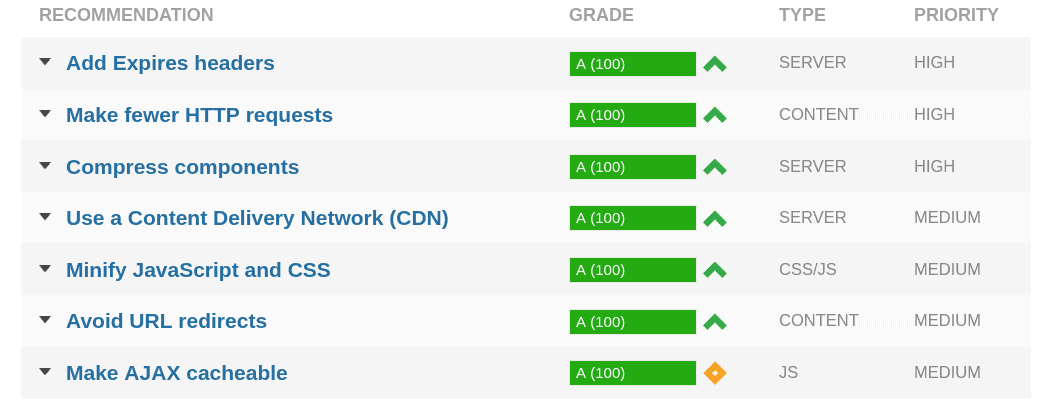
This can be achieved by optimizing and improving network and backend connection times.
Briefly, some of the factors that can cause slow TTFB are: h analysis of DNS, the database, the scripts running on the server, server hardware, server misconfiguration, no caching, webhost network and upsteam performance.
You may need professional help to successfully troubleshoot and reduce your TTFB. For the purposes of this article, we will look at the TTFB analysis.
What is TTFB?
The time it takes to wait for the initial "server response" is also known as Time To First Byte (TTFB). The time recorded is the delay of a return client connection to the server, as well as the time it takes the server to provide a response. (Source: developers.google.com)
A high TTFB is usually an indication of one or both issues:
1) Poor network conditions between client and server or
2) Slow response application or server.
A high TTFB often causes your page loads to slow down or, at the very least, to be delayed between page loads. You should check if your TTFB is a performance issue or not. Try to keep the TTFB below 200 milliseconds, or at least that is considered standard by Google. I think if you stay below 500 milliseconds the web page will be fast enough. The requests for the second consecutive test should be even lower.
TTFB control using CURL
The following is a quick example with CURL, showing how you can control TTFB from a Linux or Mac terminal. Use the following command and replace "https://iguru.gr/" with your domain:
curl -o / dev / null -w “Connect:% {time_connect} TTFB:% {time_starttransfer} Total time:% {time_total} \ n” https://iguru.gr/
Additional TTFB control methods (via browser)
In addition to CURL, you can test TTFB using the following tools.
- Google Chrome browser Inspect tool
- gtmetrix.com
- webpagetest.org
- Performance.sucuri.net
- tools.keycdn.com/performance