The Worst Ransomware Groups

From critical infrastructure to classrooms, no sector is left untouched. In July 2025, cyberattacks skyrocketed across nearly every industry and geography, marking a clear escalation in both scale and sophistication.

This analysis sheds light on the latest global trends in cyberattacks, presenting:

See more articles from iGuRu.gr when you search for news on Google.
  • The total volume of attacks worldwide
  • Targeted activity per sector
  • The areas with the highest concentration of threats
  • The latest ransomware data, including the countries most affected

The findings come from the ThreatCloud AI platform, which analyzes millions of indicators of compromise (IoCs) daily. Powered by more than 50 AI engines and powered by intelligence collected across over 150.000 networks and millions of endpoints, ThreatCloud offers one of the most comprehensive and real-time views of the global threat landscape available today.

Global Data: Rise in Attacks Across All Sectors

Total Global Attacks

In July 2025, the average number of cyberattacks per organization per week reached 2.011 . This is a 3% increase over the previous month and a 10% increase compared to July 2024. This steady increase highlights how persistent and adaptable cybercriminals remain.

Attacks by Industry

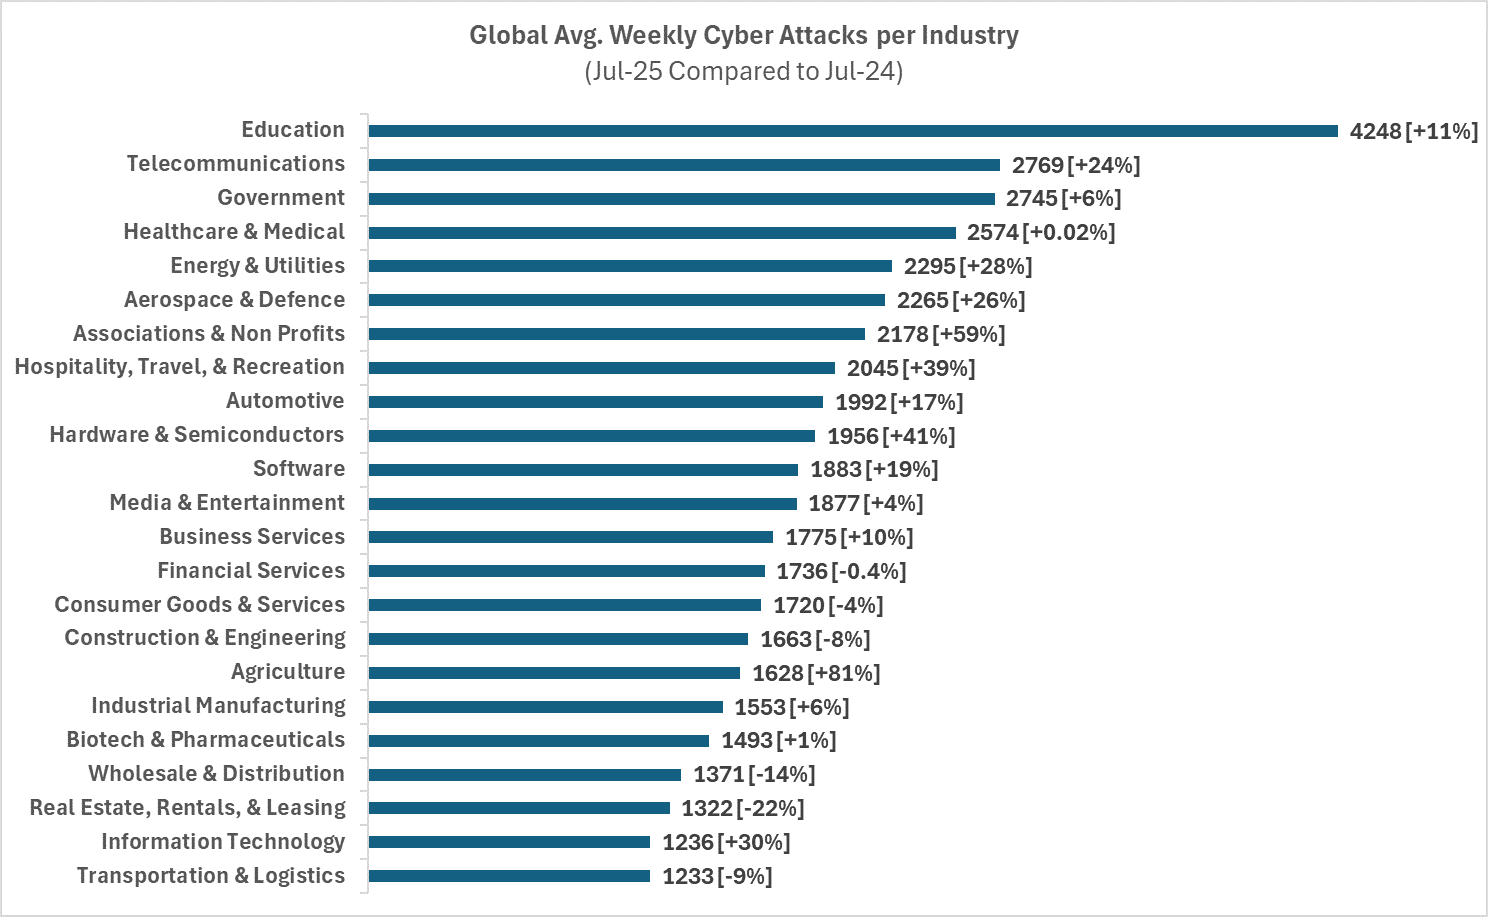
Some sectors are being hit much harder than others. At the top of the list:

  • Education: Recorded the highest number of weekly attacks, with248 per organization, noting an increase 11% on an annual basis.
  • Telecommunications: Accepted on average769 attacks per week, with rise 24 % compared to 2024.
  • Government Agencies: They faced745 attacks per week, recording increase 6%annually.
  • Georgia: Stands out with the largest percentage increase —81 % — making the industry an increasingly attractive “easy target.”

From educational networks to telecommunications giants and agribusinesses, no industry is immune — while some are becoming prime targets.

Total Attacks By Region

The threat landscape varies significantly by geographical region:

  • Asia-Pacific (APAC): Recorded the highest average with403 attacks per organization per week, noting increase 3% on an annual basis.
  • Latin America: Follow me917 weekly attacks, presenting 4% increase compared to July 2024.
  • North America: Reported870 attacks per organization, which correspond to increase 5% annually.
  • Europe: Although slightly lower in volume, it showed the most worrying trend withincrease 15% on a year-on-year basis — the largest increase of all regions.

The data reflects a global escalation in cyber risk , with the sharp rise in Europe suggesting that attackers are increasingly turning their attention to areas that were previously out of focus.

Ransomware attacks

By Region and Sector

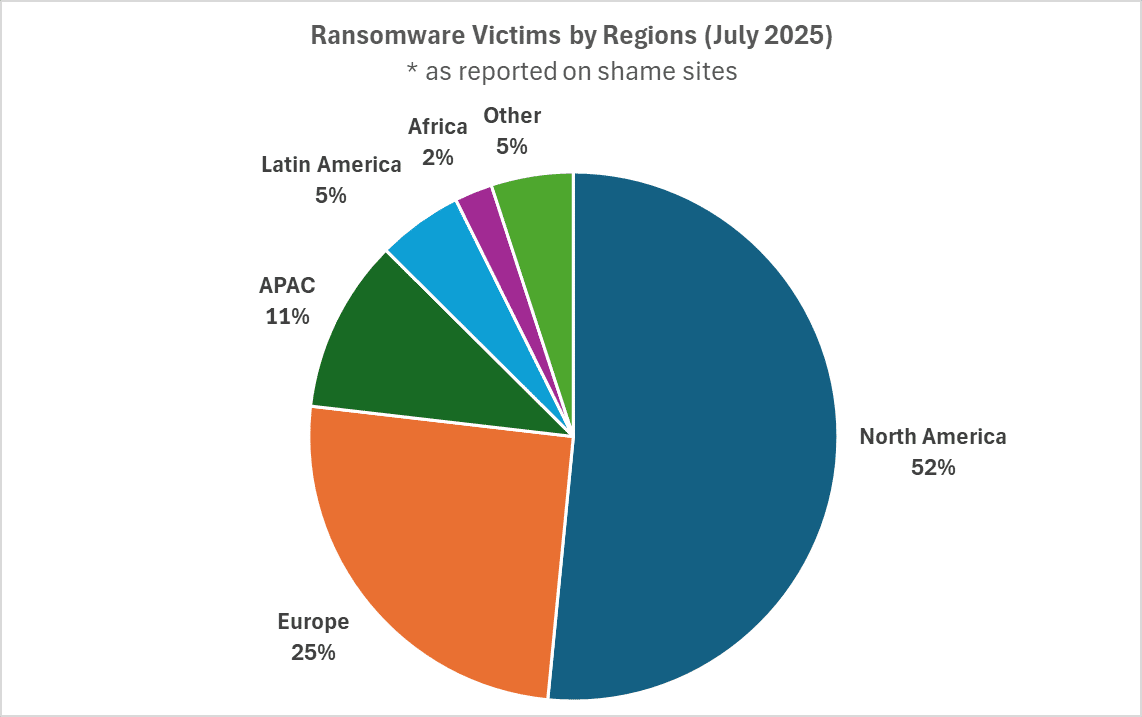
Ransomware continues to be one of the most destructive and visible forms of cybercrime. In July 2025, there were 518 confirmed ransomware incidents , a 28% increase compared to the same period in 2024.

  • North America: It took the biggest hit, concentrating the52% of all recorded incidents ransomware.
  • Europe: Follow me25 %, which highlights the continent's rapid rise on the target map of ransomware groups.

Ransomware Attacks By Industry

From a sectoral perspective:

  • The industryConsumer Goods & Services was most affected, concentrating the 12,0 % of all reported attacks.
  • The industryConstruction & Engineering Projects follow me 10,2 %.
  • TheBusiness Services completed the trio with 9,5 %.


Note: The data comes from so-called “ shame sites ” run by double-extortion groups, publicly publishing information about victims. While this data is inherently biased and incomplete, it offers valuable insights into ransomware trends and victim characteristics.

The Top Ransomware Groups

In July 2025, three ransomware - as - a - service ( RaaS ) groups dominated the landscape, accounting for a significant percentage of publicly reported attacks. The data comes from so-called “ shame sites ” run by dual-extortion groups.

  • qilin: Responsible for12 % of all published attacks, making it the most active group of the month. Originally known as "Events", has been operating since 2022, steadily expanding its infrastructure. In September of the same year, it relaunched under a new name and introduced a Rust-based cryptographer. Since March 2025 — after the withdrawal of RansomHub — Qilin has intensified partner recruitment and dramatically increased victim postings. Its partners gain access to a comprehensive admin panel, trading infrastructure, and support services.
  • Inc. Ransom: Record it9% of attacks. Active since mid-2023, it stands out for the profile of its victims: the 33 % of its targets in the second quarter of 2025 were in the Health sector and the 10 % in Education — areas that some groups typically avoid. It maintains a dual infrastructure: a credential-protected negotiation portal and a public leak site. It supports payloads for Windows and Linux and is steadily expanding its reach and capabilities.
  • Akira: Responsible for8% of reported attacks. It was first detected in early 2023 and targets Windows, Linux, and ESXi systems. Analysis of Q2025 XNUMX shows that it focuses on business services (19%) and industrial production (18%)In 2024, it introduced a Rust-based variant optimized for ESXi environments, with features for selective encryption, VM targeting, runtime control, and Peace build ID guard to avoid reverse engineering.

These groups continue to evolve in both tools and targets, making them some of the most dangerous threat actors to watch closely in the coming months.

What's Next: A Deeper Look at Trends Ransomware

The ransomware explosion seen in July caps a quarter with:

  • Expansion of threat group activity
  • Continuous evolution of ecosystems ransomware as a Service
  • Increasing pressure in critical sectors

However, the trends presented above are only part of the picture. The full Ransomware Report Q2 2025 analyzes:

  • The rise and tactics of key teams such asqilin, Inc. Ransom and Akira
  • The increasing useAI in attack methods
  • Risk patterns by industry and attacker preferences
  • Practical suggestions for defense mechanisms and infrastructure shielding

The data presented here is just a glimpse into the ever-changing landscape of ransomware and cyberattacks. As attackers evolve their techniques and expand their reach, organizations must remain informed and proactive.

For more detailed analysis, including tactics by group, regional dynamics, and practical defense strategies, download the full Ransomware Report Q2 2025. It offers an in-depth look at the threats that will shape the second half of the year.


Google preferences

Leave a Comment

Your email address will not be published. Required fields are marked *

Your message will not be published if:
1. Contains insulting, defamatory, racist, offensive or inappropriate comments.
2. Causes harm to minors.
3. It interferes with the privacy and individual and social rights of other users.
4. Advertises products or services or websites.
5. Contains personal information (address, phone, etc.).