
In this guide we will talk about Ring3 debugging
Objectives of the guide:
- Effectively analyze a Ring3 debugger, such as Immunity Debugger
- It can control the execution of the program
- Ability to monitor / change program status (registers, memory)
- Commenting on Immunity Debugger

This guide can be used as a lab module for:
- Computer architecture
- Operating Systems
- Discrete mathematics
1. Entertreatment
To reverse a malicious software, a quality debugger is essential.
There are two types of debuggers: user-level debuggers (e.g. OllyDbg , Immunity Debugger, and IDA Pro ), and kernel debugging (such as WinDbg , Softicce and Syser).
The difference between user / kernel-level debuggers is that kernel debuggers run with higher permissions and therefore can detect drivers and kernel devices, while user-level debuggers cannot.
It is known that modern operating systems such as Windows rely on the processor (eg Intel CPU) to provide a multi-layered collection of protection domains.
For example, on a typical Intel CPU, programs can run in four modes, from ring0 (kernel mode) to ring3 (user level). In this case, we also call user-level debuggers "ring3 debuggers"
One question you may have is: Since ring0 debugger is more powerful than ring3 debugger, why not use ring0 debuggers directly?
Ring3 debuggers usually come with a GUI that can significantly improve the productivity of a reverse engineer. Only when necessary will we use the command line detectors ring0 (such as WinDbg).
But there is one exception, IDA Pro has introduced a GUI that can be used in WinDbg to detect kernel errors. It's a nice feature but you have to pay for it.
In this guide, we assume that you would like to use open source tools code / free software. The following is a combination of debuggers that we will use throughout the guide: Immunity Debugger ( IMM for brevity) and WinDbg.
2. Short tour of IMM
A brief introduction to IMM.
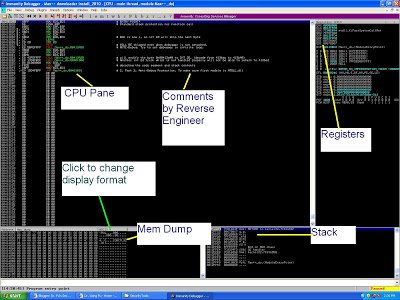 |
| Figure 1. IMM screenshot |
As shown in Figure 1, top left, we have the CPU window (which shows the sequence of machine instructions and user comments), the Register window (which you can watch and modify the register values), the Stack window and memory indicator.
Before we try to reverse the first section of Max ++, it is helpful to learn how to use the shortcut keys in the debugger effectively.
In general, to use a debugger effectively, you need to know the following:
- How to control the execution flow? ( F8 - step up, F7 - step, F9 - Continuity, Shift + F9 - continuation and exclusion)
- How to look at the data? (In the Memroy window: right click -> binary -> processing , in the registration window: right click -> edit)
- How to set breakpoints? ( F2 for soft-breakpoint switching, F4 - run the cursor, right click on the command -> Breakpoint -> on hardware and memory access point )
- Comment ( ; for comment)
Most of the above are in the IMM debug menu, however, it is always helpful to remember the shortcut keys. We briefly explain some of the functions that are very useful in analysis.
2.1 Execution flow control
The difference between step over / step in is similar to all other debuggers.
The step in (F7) enters the function of a call command. Step over (F8) performs the entire operation and then stops at the next instant command. Note that the F8 may not always give you the result you want.
F9 is often used to continue from a point where you have stopped. Note that debugger automatically handles many exceptions for you. If you want to keep track of all the exceptions, you should use SHIFT+F9 . Later, we will see an example where Max ++ rewrites the SEH (structured exception) to detect the existence of debuggers. To work around this anti-debugging trick, you will use SHIFT + F9 to manually check the SEH code.
2.2 Data handling
Generally, you have three types of data to manage: (1) registers, (2) stack (Stack) and (3) all other sections (code, data and stack).
To change the value of a registry, you can right-click on the registry and select Edit to change its value. Note that when a registry contains a memory pointer (the address of a memory slot), it is very convenient to right-click on it and select " Follow in Dump " the " Follow in Stack ”To see its value.
The IMM design does not allow you to instantly change the value of the EIP registry in the Register window. However, it is possible to change the EIP using the Python shell window.
In the Memory Dump window, select and right-click on any data, then select Binary-> Edit . You can enter data easily (as a string, or as a binary number).
You can reset the password (as data). In the CPU window, right-click and select " Assemble ", Where you can directly modify the code section.
You can even modify a program using this feature. For example, after modifying the code snippet, you can save the modified program using the following approach:
(1) Right-click on the CPU window
(2) Copy to executable
(3) Copy all
(4) Close the dialog box (list of modified instructions)
(5) A dialog box then appears asking for "save the file". Select "yes" and save it as a new executable file.
2.3 Breakpoints
Software breakpoints (F2). They are similar to the breakpoints available in language debuggers. You can have unlimited breakpoints (BP) and you can set conditions on a BP (eg, to specify that BP should stop the program only when the value of a registry is equal to a certain number).
BPs are applied using the directive Int 3 .
Basically, every time you set a breakpoint in a location, the debugger replaces the FIRST byte of this command with INT 3 (one byte command) and saves the old byte.
Each time the program runs at this location, a pause is made and the debugger is called to handle this exception.
Thus, the debugger can then perform the condition check at the breakpoint and stop the program.
Hareware breakpoints can be configured by right-clicking in the CPU window and then selecting Breakpoints -> Hardware, at runtime .
Note that there are two other types of availalbe ( reading memory , memory access ).
As the name implies, BPs are achieved by exploiting the hardware. In an Intel processor, there are four hardware BP registers that record the location of BPs. This means that at any time, you can have up to 4 BP .
Hardware BP is very useful if you need to know which part of the code modifies a variable. Just set the BP memory access to it and you do not have to look at the whole source code to find out.
2.4 User comment
Although seemingly insignificant, user feedback and annotation is a very important function during a reverse effort.
In the CPU window, pressing “;"Allows you to add a comment to a directive and by clicking":”Allows you to highlight a location. Later, when the location is reported as a variable or function, its tag will appear.
This will greatly facilitate the analysis process.