
During this uncertain period of lockdown for COVID-19, we try to get information from experts and from every government, around the world. The information and instructions should be as simple and precise as possible to ensure that everyone understands and follows them.
Ας δούμε όμως τι έγινε στις 10 Μαΐου, όταν ο Twitter λογαριασμός του πρωθυπουργού Boris Johnson κυκλοφόρησε μια σειρά από "infographics" που μάλλον προκαλούν ανησυχία.

So far, the charts are still there available and no explanation has been given.
Ο στόχος των γραφημάτων ήταν πρωτίστως να παρουσιάσει την ιδέα των "επιπέδων συναγερμού για τον COVID", τα οποία κυμαίνονται από το ένα (όταν o Covid will no longer exist in the UK) until five (risk of healthcare system collapse).
The graphics are nice, but unfortunately, they are almost useless.
For a start, choosing a scale from one to five is quite arbitrary. Of course, the choice of scale is subjective and aesthetic, and does not apply to the real problem. When you analyze the graphs and the equation behind these things become very dark.
Let's look at the amazing equation
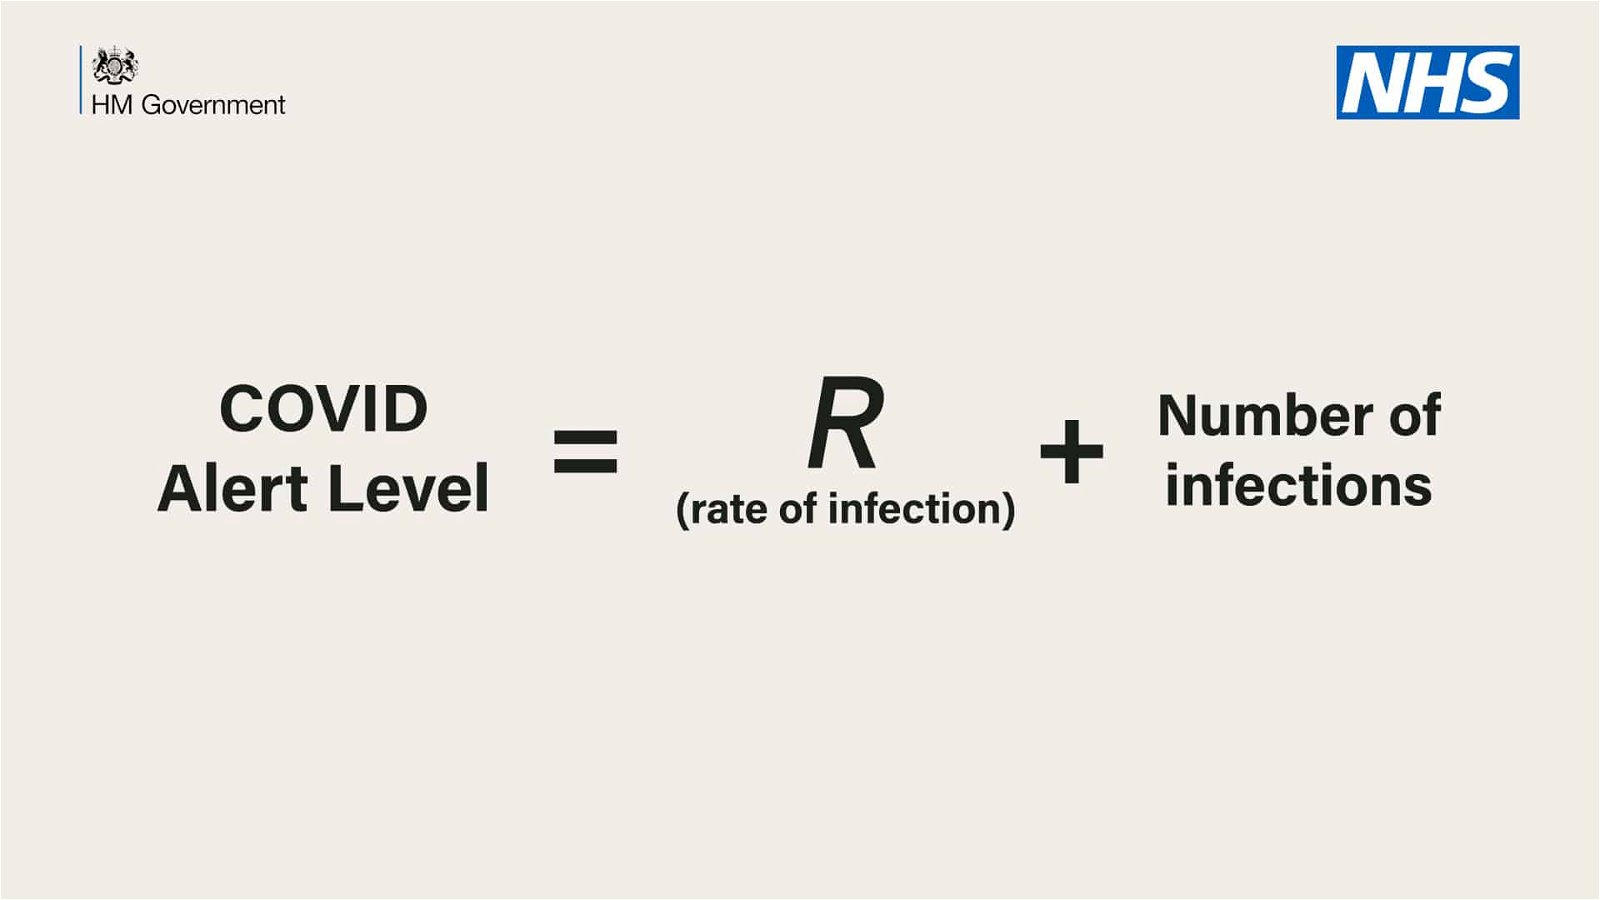
The level prenoticeς εξηγείται από την παραπάνω εξίσωση: "COVID alert level = R (ποσοστό μολύνσεων) + αριθμός λοιμώξεων."
Unfortunately, the equation is nonsense for a number of reasons. To understand why, let's look at something we call units.
Μπορεί να σας ζητήθηκε από τον δάσκαλό σας κάποια στιγμή στο Δημοτικό να χρησιμοποιήσετε μονάδες στις απαντήσεις σας. Για παράδειγμα, μια απάντηση σε ένα πρόβλημα μπορεί να είναι "τρία μήλα", "τρία μέτρα" ή "τρία χρόνια". Ο δάσκαλός σας προσπαθούσε να σας διδάξει τη σημασία της κατανόησης των μονάδων. Δηλαδή, δεν μπορείτε να προσθέσετε τιμές που δεν έχουν τις ίδιες μονάδες, για παράδειγμα, "τρία μήλα + τρία μέτρα" δεν έχει νόημα.
This shows us the fundamental error of the government equation, which tries to connect the following three parameters.
1. The warning level, which is a number without a unit between one and five.
2. Το R, το οποίο περιγράφεται ως τον "ρυθμό των μολύνσεων" στην εξίσωση. Ανάλογα με τον ορισμό που χρησιμοποιείται (αυτός δεν είναι και πολύ σαφής από το πλαίσιο) θα μπορούσε να δείξει πόσα άτομα μολύνει κάποιος σε ένα δεδομένο χρονικό διάστημα. Αυτό υποτίθεται ότι είναι ένα ποσοστό, και αν θέλουμε να το κάνουμε μονάδες θα πρέπει να το αναφέρουμε σαν "άνθρωποι ανά μέρα" ή απλά "ανά ημέρα" και αυτό δεν είναι σαφές. Στην επιστήμη, ωστόσο, το R συνήθως δεν είναι ένα ποσοστό αλλά μια αρίθμηση της αρίθμησης που αντιπροσωπεύει τον μέσο αριθμό ατόμων που έχουν μολυνθεί από κάθε ασθενή.
and 3. The number of new infections to be measured in human units.
Sounds logical. We want an alert level to be based on these factors. However, you can not just add them. You cannot add person units per day plus people and receive a number without a unit between one and five.
Depending on what R means, it will be small, probably somewhere in the area of one, while the number of infections will be somewhere in the thousands. This not only means that adding R is not related to the sum, but it also means that the alert level will be out of the range of 1 to 5, and will reach thousands.
Now let's move on to the chart below, which shows information on the steps to unlock. We see a curve with a bell that decreases slowly and suggests steps to facilitate the lockdown in its course. But there is no relationship between the steps in the graph and the level of the warnings, so we have to ask ourselves what the equation is.
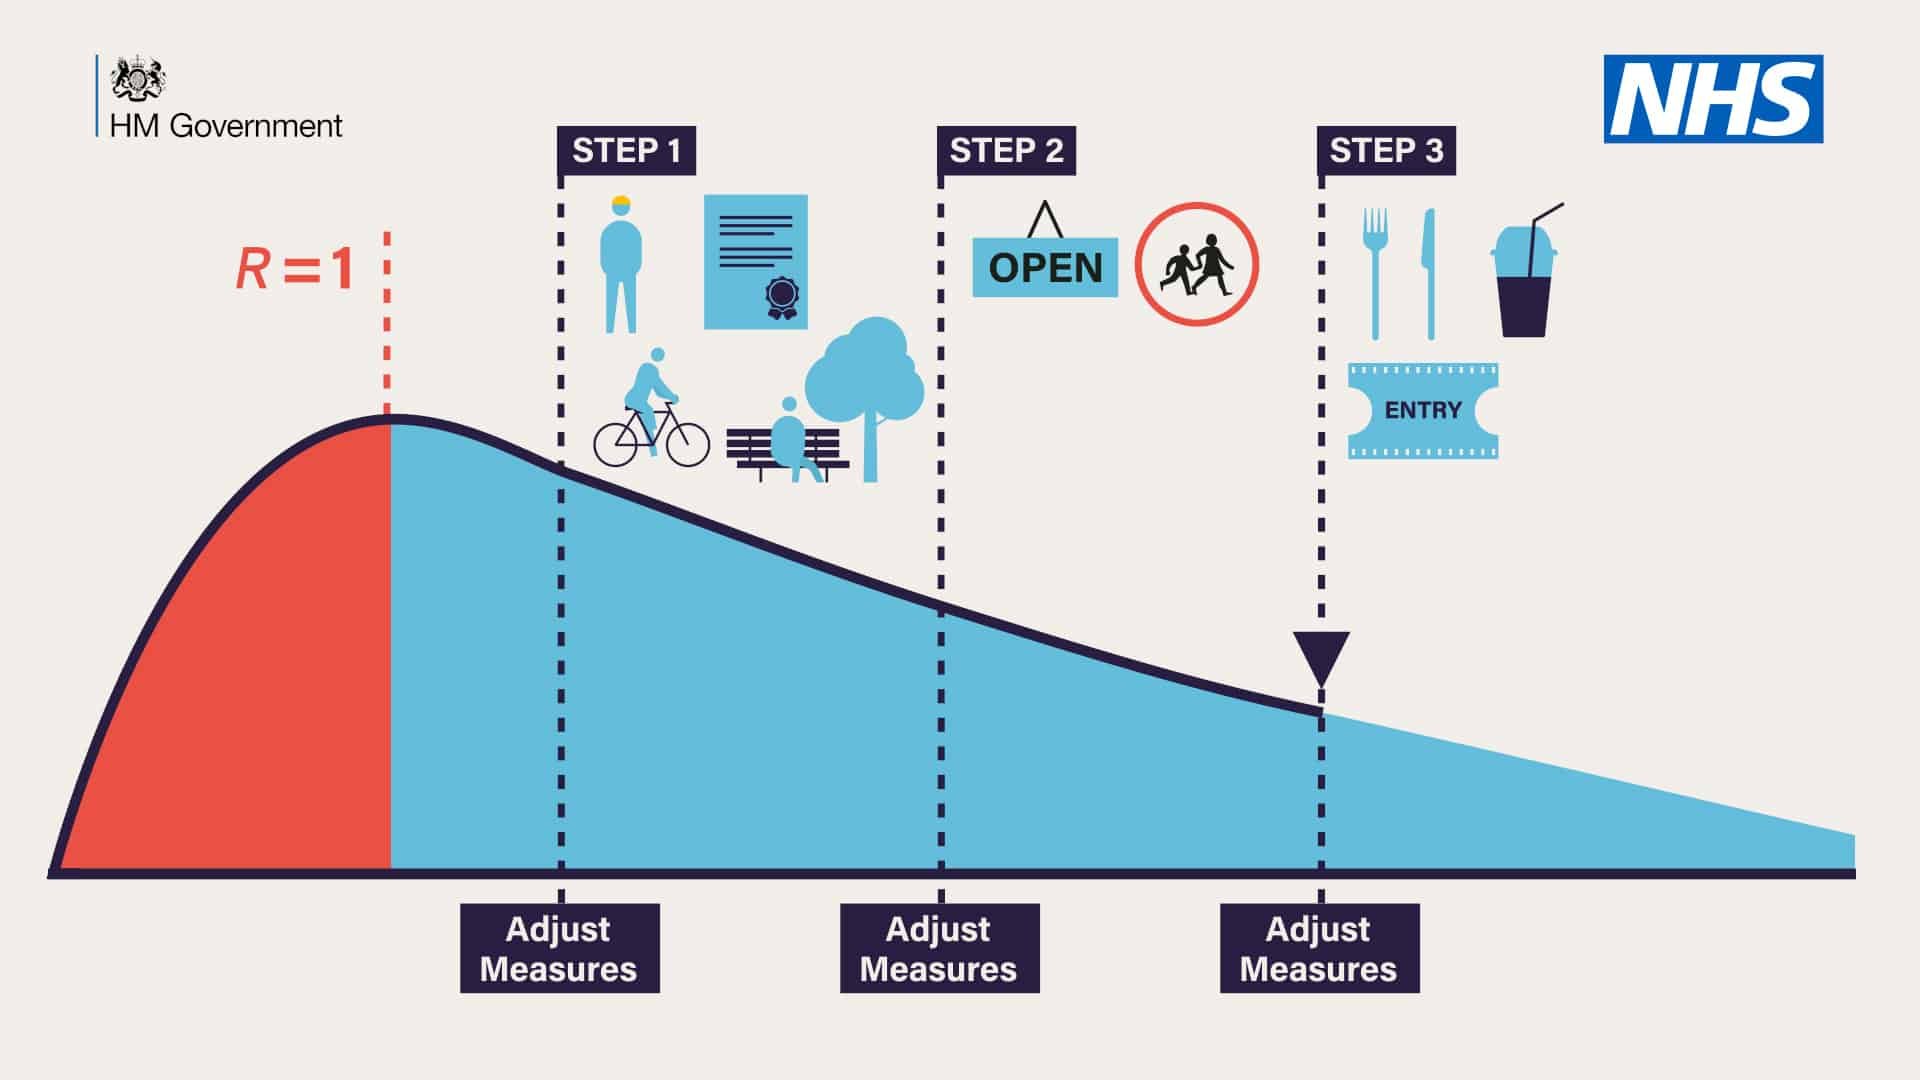
In addition, the vertical (y-axis) and horizontal (x-axis) of the graph do not have a number. So what is the information presented in the graph?
A safe assumption is that the x-axis is time. But are they days, months or years? This is very important because if we assume that the red part shows us from January to May, then the blue part of the curve probably covers almost two years. Since there is no numbering, the interpretation of what red means and what blue should probably concern us.
And what is the y-axis? We could assume that it is R since a value of R is given at the top of the curve. But why choose one to design the R and not something more comprehensible, say the number of cases? So the lockdown was imposed because R became bigger than one. However, the graph shows that R was at its peak, even though R was higher than one in the previous interval. Again this confuses the public as to what R. means.
Of course, graphs try to be explanatory, conveying general and simple ideas, rather than accurate data. However, at a time when every government wants to instill confidence in their information and expertise, these numbers just make things worse for those who know how to read charts. Επιφέρουν σύγχυση και ασυνέπεια στα μηνύματά τους που "οδηγούνται από την επιστήμη".
This article was republished by The Conversation. Written by Thomas Woolley, Lecturer in Applied Mathematics, at the University of Cardiff with Creative Commons license.

math "stupid-19" IQ, ie "cuts-19" IQ in mathematics