
Windows Performance Monitor is a useful feature where you can examine how running programs affect your computer's performance in real time.
What is Performance Monitor in Windows?
Windows Performance Monitor is a Microsoft Management Console (MMC) snap-in that provides information for analyzing system performance.
From a single console you can monitor application and hardware performance in real-time, customize the data you want collected in logs, set thresholds for alerts and automatic actions, generate reports and view historical performance data in multiple ways.
The tool this, also known as PerfMon.exe or PerfMon.msc, along with the Resource Monitor and Reliability Monitor of Windows are a reliable trio of functions that can inform you about the behavior of your operating system.
Windows Performance Monitor uses performance counters, event detection data and configuration information, items that can be combined into Data Collection sets.
- The Performance counters are measurements of system state or activity. They can be included in the operating system or be part of individual applications.
- The Event detection data collected by tracking providers that are components of the operating system or individual applications that report actions or events.
- The Configuration information collected from key values in the Windows registry. Windows Performance Monitor can record the value of the registry key at a specific time or interval as a log file segment.
How to open Performance Monitor in Windows
If you're having problems with your Windows PC's performance, one tool that can help you pinpoint what's wrong is the old, classic Performance Monitor, which has been available on Windows operating systems since 1993.
This tool can help you monitor how your computer's processor, memory, or storage is being used to troubleshoot problems.
But, before using it, you need to know how to start it. There are about 10 ways to start Performance Monitor in Windows 10 and Windows 11. Let's not get so detailed and look at the two main ones:
Through Search
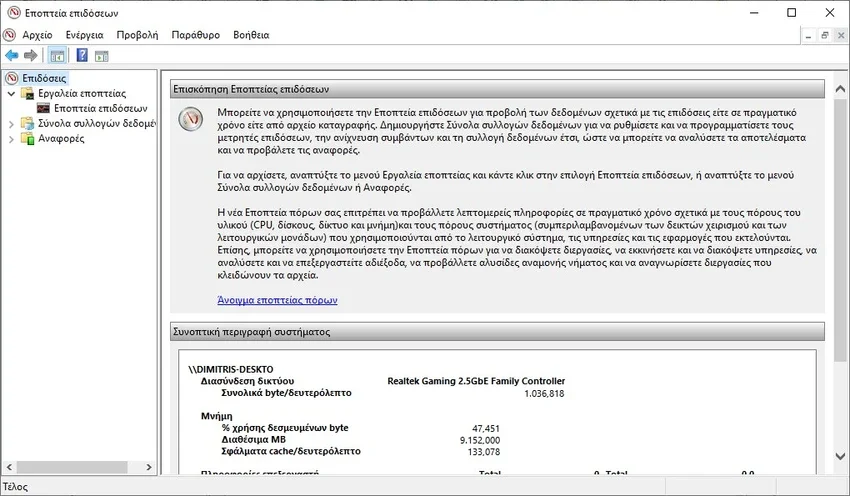
Ο πιο απλός τρόπος. Πληκτρολογείτε στην Αναζήτηση για Ελληνικά Windows την λέξη "Εποπτεία" (προσοχή θέλει τόνο).
Στα Αγγλικά Windows πληκτρολογείτε "Performance" . Και στις δύο περιπτώσεις κάνετε κλικ στο αποτέλεσμα της αναζήτησης που είναι πιο κοντά στο επιθυμητό.
Η application Performance Monitor θα ανοίξει σε λίγα seconds and it will look like the screenshot below:
Through the Commencement
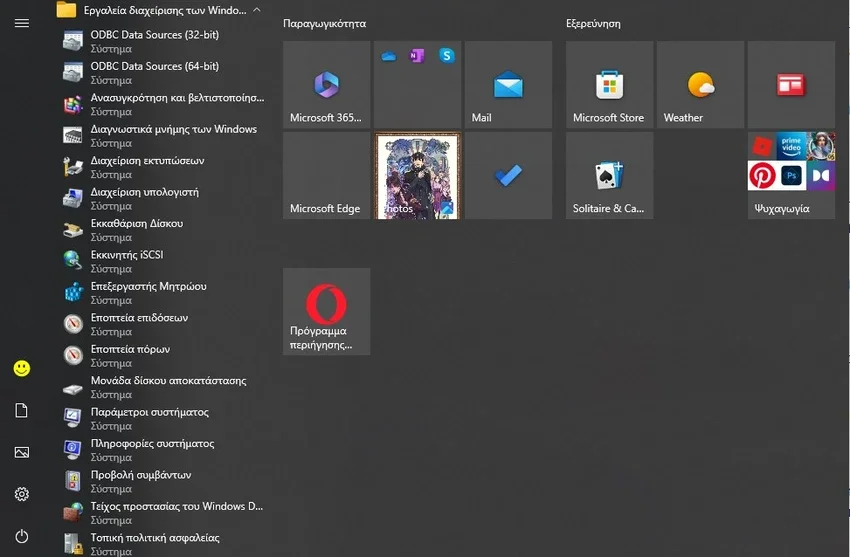
Το εργαλείο Performance Monitor είναι διαθέσιμο μέσω του μενού Έναρξη. Απλά κάντε κλικ στο εικονίδιο των Windows από τη γραμμή εργασιών και στο μενού με τις εφαρμογές σας μετακινηθείτε προς τα κάτω στο φάκελο "Εργαλεία διαχείρισης των Windows".
Click it to expand it, then find and click the Performance Monitor shortcut.
Analyze system performance with Performance Monitor
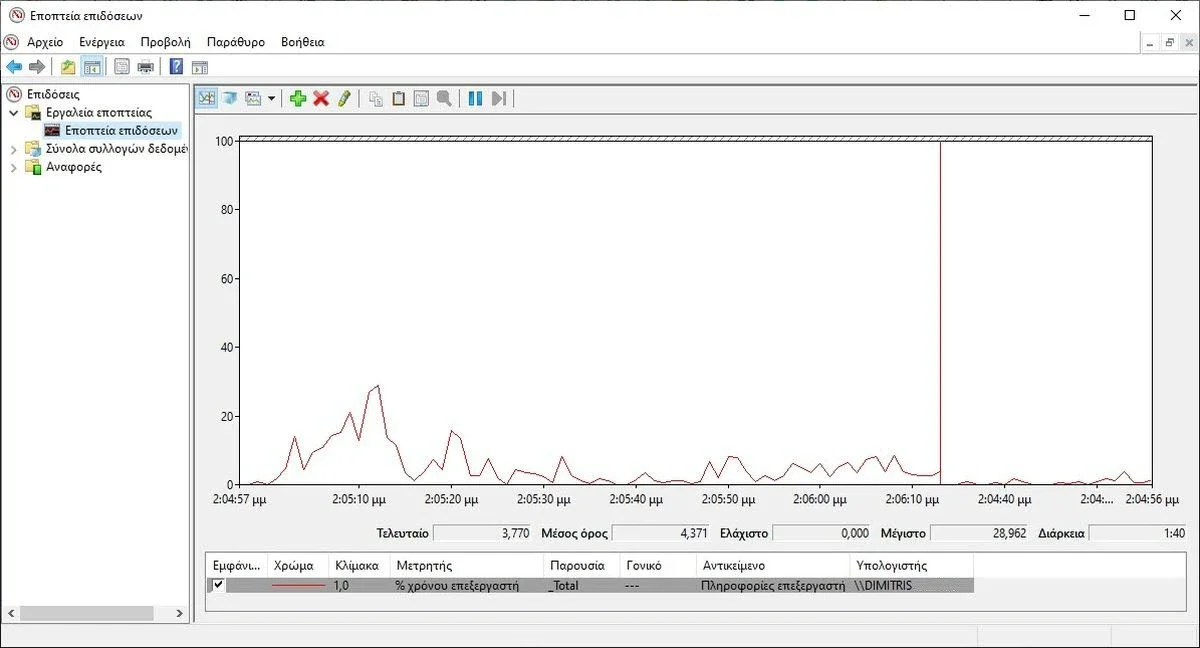
Για να ξεκινήσετε μια ανάλυση της τρέχουσας απόδοσης του υπολογιστή σας, κάντε κλικ στο "Εποπτεία Επιδόσεων" (Performance Monitor) κάτω από το "Εργαλεία Εποπτείας" (Monitoring Tools) στον κύριο πίνακα του προγράμματος.
If you want to see how your computer is performing when using a specific set of apps and programs, be sure to open them now so the graphs can note their impact on your system resources.
By default, the graph displayed by Performance Monitor measures processor time, which is the time the processor is busy running active programs (shown in percentages). This gives you a basic measure of how hard your processor is working.
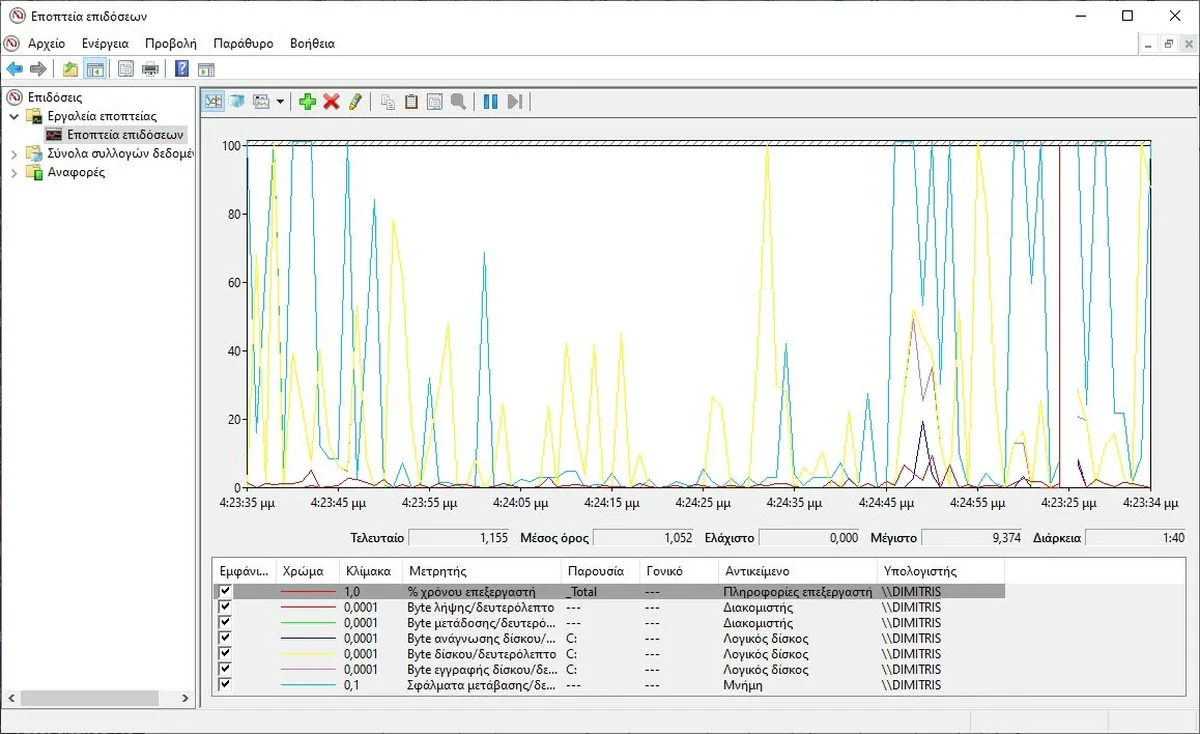
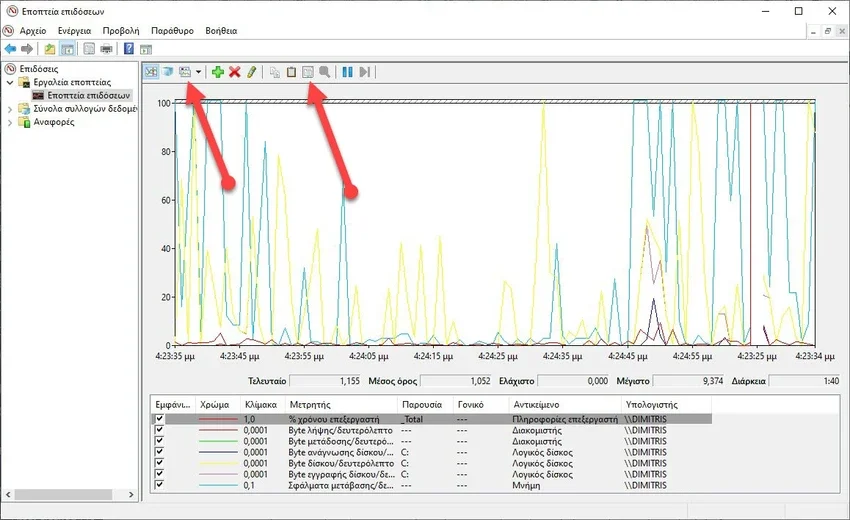
The chart can be customized with additional columns and many other options. For a more in-depth analysis, you can also add counters to the chart that can report other data. To do this, press the green plus sign above the graph (or alternatively Ctrl + N).
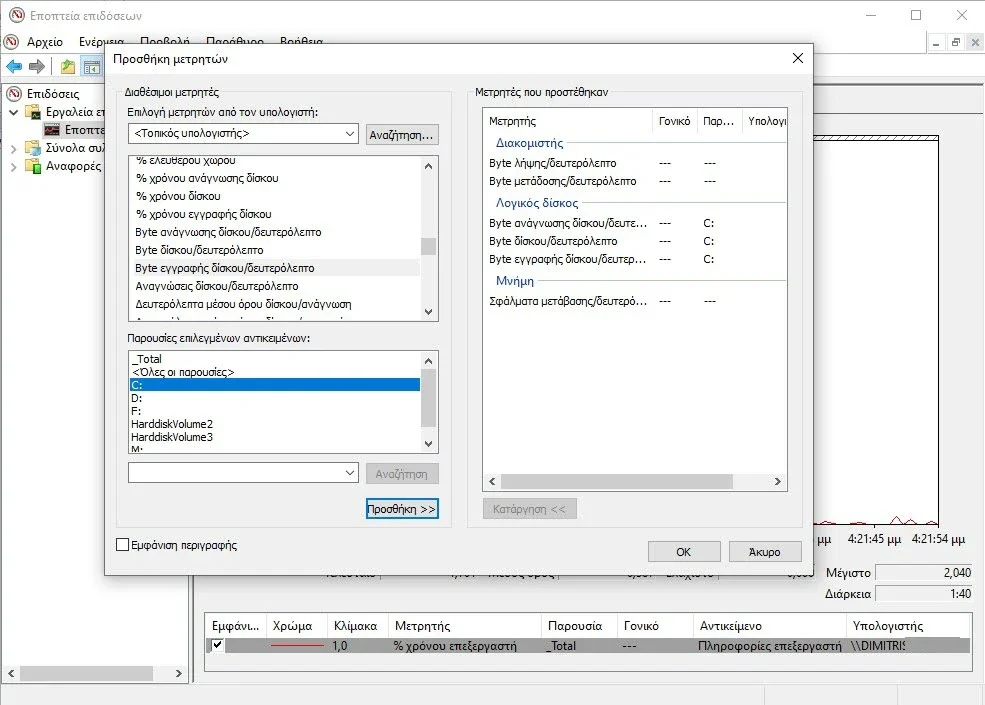
In the Add Counters window that will open, you can select the counters you want to monitor in real time. They are organized by type and material and there are a lot of them.
If you double-click on a counter's name, you should see several individual items, and you can choose to track any of them, as well as all of them.
When you're done selecting the counters and items you want to track, click or tap the Add button. Added counters appear on its right side window. When you click or press OK, they are added to the chart by Performance Monitor.
Customization of display mode
Μπορείτε επίσης να δείτε τα δεδομένα σε άλλες μορφές κάνοντας κλικ ή πατώντας στο κουμπί "Αλλαγή τύπου γραφήματος" (ή πατώντας CTRL + G στο πληκτρολόγιό σας) και επιλέγοντας τη "Γραμμή ιστογράμματος" ή την επιλογή "Αναφορά".
You can further change how the data is displayed by clicking the Properties button highlighted below or by pressing CTRL + Q on your keyboard.
This opens the Performance Monitor Properties window, where you can customize how each counter is displayed, what color it corresponds to, what line type to use, and so on. You can use both the Data and Graph tabs for this type of personalization.
When you're done personalizing everything the way you want it, don't forget to hit the OK button.
What are the most useful metrics in Performance Monitoring?
The data included in Performance Monitor's graphical reports are technically highly technical, but difficult to understand by ordinary users.
However, there are some counters that are more useful than others, at least for the average user with a Windows PC at their desk. Here's a selection of performance metrics that can help you see if something isn't working right:
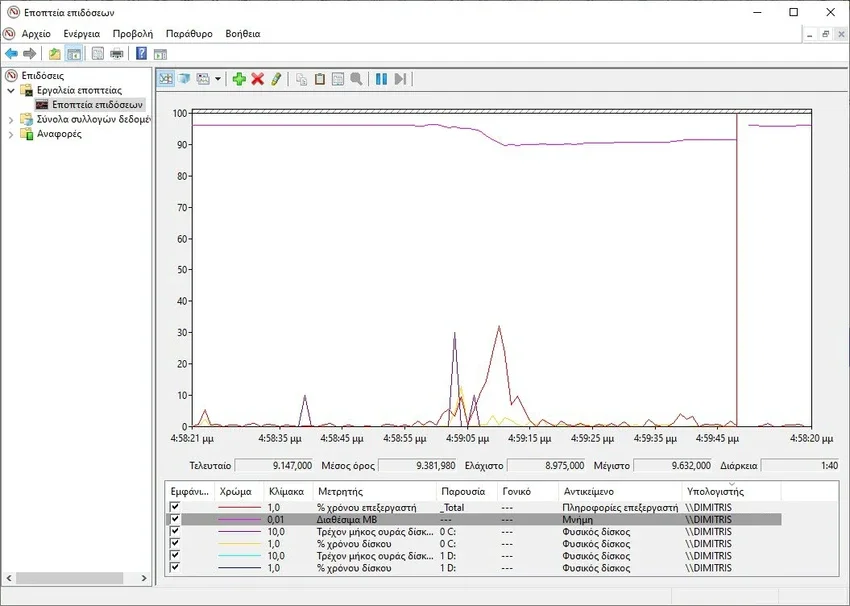
- Processor -> % Processor Time : you can find him in the Editor cash list. It shows you the time the processor spends on various tasks. If its value is consistently above 80%, it means that your processor is not powerful enough to keep up with what you are doing on your computer, so it becomes a bottleneck. Although one solution to this issue would be to use less demanding applications on your computer, the only long-term solution is to upgrade your processor.
-
Memory -> Available MB : located in the Memory counter list. You can add this counter to your graph to see if your system has enough available memory to use. If the graph shows you that the available memory is somewhere less than 10 percent of your total, it may mean that you don't have enough RAM installed. In this case, consider adding a little more.
-
"Φυσικός Δίσκος -> Τρέχον μήκος ουράς δίσκου" and separate it "Φυσικός Δίσκος -> % Χρόνου Δίσκου" : For each disk you have, these two counters are both in the PhysicalDisk list. If the current disk queue length is greater than 2 and the disk time is closing at 100%, it is possible that the hard disk you are monitoring is very slow or even faulty. In this case, you may want to consider upgrading your hard drive.
Understand all the data available
Actually the list of counters available in Performance Monitor is extremely long and we cannot cover everything in a single article.
However, if you're looking for a good knowledge base that explains all the unusual terms like %DPC Time or Page Faults/sec, read this Microsoft TechNet entry: Performance Monitor Counters. There you will find full information on each meter found in the standard report list.